
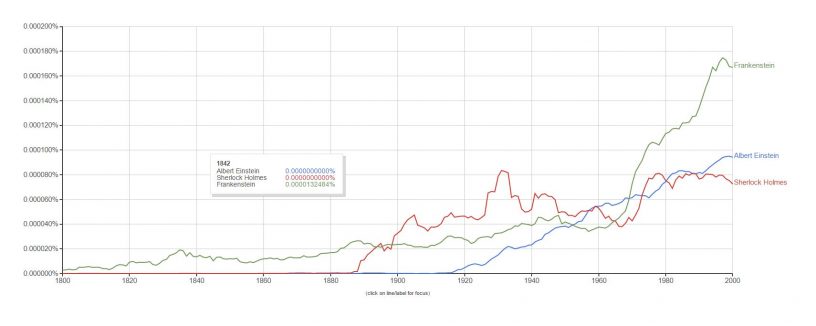


Glenn McDonald creates the data on “Every Noise at Once,” beautifully and randomly. He was able to group music in a seemingly random data. However, when you look and listen more closely the data’s are organized. The music varies from hard rock to soft jazz music. He was able to use scatter plot to manipulate his data to the way he wants it, by listing about 1514 genres. This information teaches us about different types of music and how each one coincides with one another.
The Virtual St Paul Cathedral project depicts Easter Sunday 1624. The site allows us to hear sermons by John Donne, who was Dean of the cathedral. This project was created for those who are unable that visit the Cathedral so they be able to experience history as it unfolds. He was able to accomplish the recreation of the Cathedral by using multimedia and the eight elements of digital literacies, which are cognitive, constructive, communicative, civic, critical, creative, confident, and cultural.
For example, he was able to use multimedia as forms such as text, audio, images, animations, video and interactive content in order to recreate Easter Sunday. Also, he used digital literacies to help with enhancing the features of Easter Sunday to make it look believable by allowing us to experience the choir, organs, and the sermons by John Donne. The images on the sites allow us to understand what it meant by cathedral, which was a big and beautiful place to worship in the 16th and 17th century.
For those who is not familiar with how to use technology are who have a hard time navigating through sites, will find that this particular site is easy to navigate through. For instance, if you are looking to listen to the sermon, all you have to do is press the link that says sermon.
Andie Silva (she/her)
I would like to get a better sense of what you experienced going thorough the site, Prittania. It’s interesting to me that you would use Belshaw here, but I need more to go on. Why do you see these sites as Remix? Why did you choose that feature image? What do you understand by “scatter plot” and why is that useful or significant? A few more specifics here would really help this blog shine.